Supporting Covid claims with resource, progress and productivity analysis
1st December 2022

The onset of Covid feels like a ‘flash in the pan’ but its effect on construction projects is still hotly debated as contractors seek compensation for lost time and/or money. In many cases, construction works continued throughout the pandemic albeit at a lesser pace due to government working restrictions. Therefore, complexities may arise in demonstrating or assessing the loss of progress due to Covid and separating the impact from pre-existing and non-Covid related issues.
“The productivity loss caused by all other events must be excluded from the claim” [1]Society Of Construction Law Delay and Disruption Protocol, 2nd Ed. Part B Paragraph 18.6
A loss of progress can result in delay and additional costs. A good starting point is to understand the entitlement to additional time, costs, or both. If the impacted activities are on the critical path, then an extension of time claim may be applicable. Even if the impacted activities are not on the critical path and delay has not been incurred, the contractor may be entitled to additional costs associated with the disruption of the impacted activity. In any case, a resource, productivity and progress analysis can be utilised to support a claim.
In simple terms, a resource, productivity, and progress analysis is an assessment of input versus output over a period of time. In the context of pipe welding, the amount of labour hours expended is the input, the diameter inches of welding completed is the output and productivity is the rate of output per unit of input. The output, or total diameter inches of welding completed, is then divided by the total diameter inches of welding to be completed to calculate actual progress achieved.
Whilst resource and productivity rates combine to provide the rate of progress, the two are not directly linked and should be assessed separately as a reduction in resource does not automatically result in a reduction in productivity. However, they can also offset each other to maintain progress, for example, if productivity halved but the resource doubled then progress would be unaffected.
“Work that is carried out with a lower than reasonably anticipated productivity rate … will lead to: (a) activity delay; or (b) the need for acceleration, such as increasing resources, work faces or working hours, to avoid activity delay; or (c) a combination of both – and therefore, in each case, loss and expense.” [2]Society Of Construction Law Delay And Disruption Protocol, 2nd Ed. Part A Paragraph 5
The units utilised in the calculations directly influence the accuracy of the analysis. In pipe welding, the records may detail spool count, the number of welds completed and the total diameter inches of those welds. The unit which best represents the lineal measurement of the works completed will provide the most accurate analysis which in this example is diameter inches. To provide a further example, quantifying the amount of tarmac required to surface a motorway by the amount of junctions would not be an accurate lineal measurement as some junctions may be 5 miles apart and others may be 10 miles.
The detail of the information contained within the contemporaneous records determines whether or not such an analysis can be conducted. To provide a benchmark, normal working methods must be demonstrated which may be derived from the planned figures or preferably input and output rates during a period of normal productivity. In order to gauge actual input and output, labour timesheets which detail the individual hours worked each day on each activity are required along with the date, size and location of each weld completed.
“Without records of planned and utilised resources it will be more difficult for the Contractor to prove entitlement to time and costs …” [3]Society Of Construction Law Delay And Disruption Protocol, 2nd Ed. Part B Paragraph 1.23
If such records exist, then analysis can be conducted which provides the most accurate assessment of deficiencies in resource and productivity. When a normal period of works is compared with an impacted period of works, to calculate the deficiencies in productivity associated with the impact, this is referred to as the ‘measured mile approach’. This is a prominent project-based analysis method endorsed by the Society of Construction Law Delay and Disruption Protocol as its preferred approach.[4]Society Of Construction Law Delay And Disruption Protocol, 2nd Ed. Intro Paragraph K (f In the absence of sufficient project records, other methods such as an industry or cost-based analysis may be appropriate.
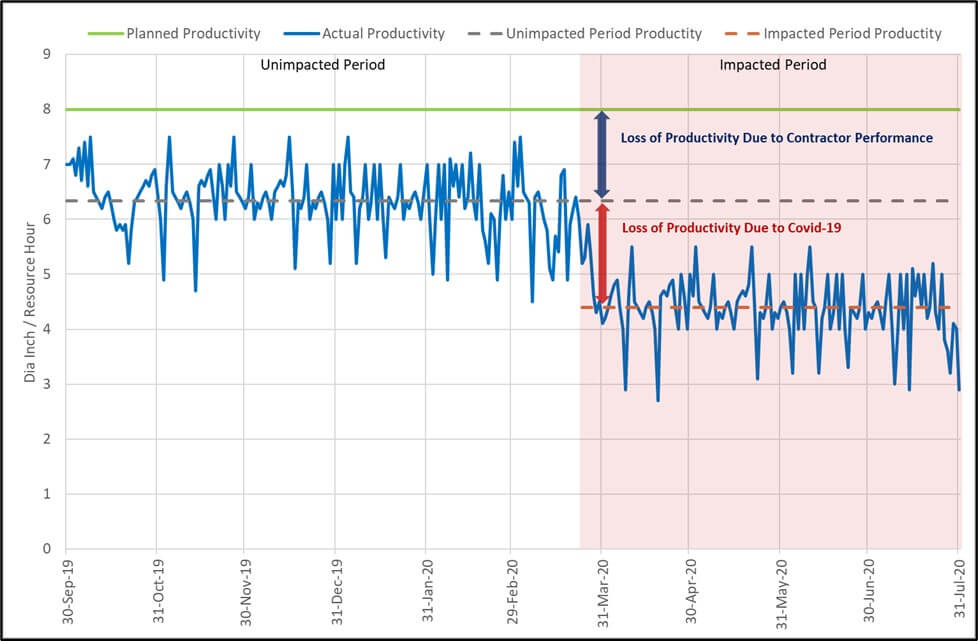
By way of example, the figure below demonstrates the application of the measure mile approach for welding using the planned and actual productivity data:
Actual daily productivity and progress calculations can be conducted by carrying out the following steps:
- Identify the number of labour hours recorded by the welding team during day 1 of the analysis;
- Calculate the diameter inches of welding completed during day 1 and divide it by the number of hours worked to provide the productivity rate in diameter inches per hour; and then
- Divide the cumulative amount of diameter inches completed by the total number of diameter inches to be completed to provide progress.
This method can then be replicated across all relevant days to produce a histogram comprising the planned and actual productivity and progress data. If the available project data is sporadic, weekly or monthly intervals may be used.
In the example above, the contractors productivity is lower than planned. As previously explained, to avoid delay, the contractor would need to increase its resources sufficiently to counteract the lower than planned productivity.
A similar method to the ‘measured mile approach’ can also be utilised to demonstrate the effect of Covid on the workforce. For instance, the graphic below shows that the resource hours expended during the Covid-19 (impacted) period were significantly less than the resources hours expended during the pre-Covid (unimpacted) period.

Furthermore, an assessment of the planned versus actual progress can then be utilised to quantify the amount of delay accrued during the impacted period, as shown in the following chart:
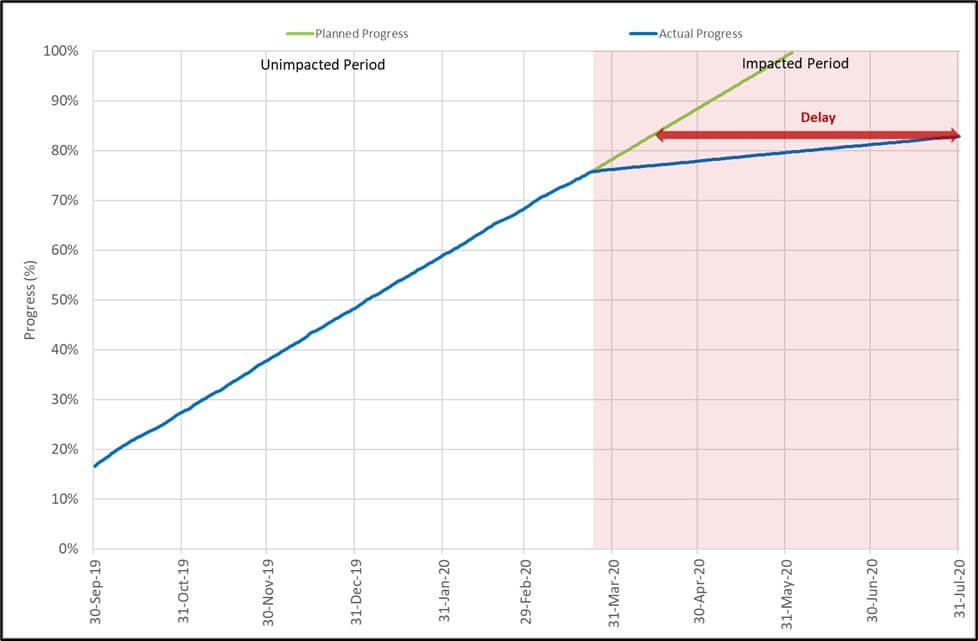
The above example demonstrates that the contractor progressed the works on time until the start of the impacted period as its additional resource offset the lower than planned productivity. For example, the same rate of progress is achieved in both of the below scenarios:
- 100 (resource in hours) x 10 (productivity in dia inch / hour); Or
- 200 (resource in hours) x 5 (productivity in dia inch / hour).
However, both resource and productivity fall significantly below the planned amount during the subsequent impacted period resulting in delay. The amount of delay accrued during the impacted period has been calculated as follows:
31 July 2020 (the date at the end of the impacted period at which point 83% of progress had been achieved) less 13 April 2020 (the date when 83% of progress was planned to be achieved) less 0 days delay (accrued prior to the impacted period) = 109 days delay (accrued during impacted period)
Once the effect has been established, a timeline of potential causative events relating to Covid can be plotted onto the histogram at the point in time in which they occurred. The histogram can then be utilised to analyse the effect that the Covid related events had on resource, productivity and progress. For example, immediately after the introduction of government legislation requiring the contractor to work at 50% capacity, the histogram would show a sharp drop in resource and a reduced rate of progress (provided that productivity remained the same or less). Furthermore, the introduction of a 2-metre social distancing rule could result in decreased productivity due to welders working without assistants or changing the sequence to avoid congested areas. In this instance, the histogram would show a drop in the actual productivity achieved during the Covid-19 (impacted) period as compared to the actual productivity achieved during the pre-Covid (unimpacted) period, when the 2-metre social distancing rule had not yet been introduced.
Accordingly, the measured-mile type of disruption analysis can be utilised to compare productivity rates during the Covid period with productivity rates from an unaffected period to demonstrate cause and effect. It is noted however that this is not a viable option if the project or task was impacted from the outset.
“Care must be exercised to compare like with like. For example, it would not be correct to compare work carried out in the learning curve part of a project with work executed after that period.”[5]Society Of Construction Law Delay And Disruption Protocol, 2nd Ed. Part B Paragraph 18.16 (a
The analysis can also be utilised to separate pre-existing and non-Covid related delays occurring during the impacted period. In our previous example presented above, the deficiency of actual progress compared to planned progress immediately before the Covid delay event began represents the pre-existing delays. The histogram can then be analysed to identify changes in resource, productivity and progress which do not have a causal link to Covid. In such instances, further investigation would be required to establish the true cause of delay.
Conclusion
The importance of good record keeping throughout the entirety of the project cannot be emphasised enough. Not only does it assist with the preparation of claims, but it also allows the parties to identify and take a proactive approach towards mitigating delay. Therefore, provided that records detailing the input and output rates were recorded consistently, a resource, productivity and progress analysis can be undertaken to assess the disruptive effect of Covid (or any other event that might affect productivity for that matter). A productivity and/or resource histogram can then be plotted and used as a basis for establishing the causative links between the various events (both Covid and non-Covid related) and their effect on the project. If a cause and effect link can be established and contractual entitlement exists, then this form of analysis can be used to support a Covid claim for additional time and/or cost.
References
| ↑1 | Society Of Construction Law Delay and Disruption Protocol, 2nd Ed. Part B Paragraph 18.6 |
|---|---|
| ↑2 | Society Of Construction Law Delay And Disruption Protocol, 2nd Ed. Part A Paragraph 5 |
| ↑3 | Society Of Construction Law Delay And Disruption Protocol, 2nd Ed. Part B Paragraph 1.23 |
| ↑4 | Society Of Construction Law Delay And Disruption Protocol, 2nd Ed. Intro Paragraph K (f |
| ↑5 | Society Of Construction Law Delay And Disruption Protocol, 2nd Ed. Part B Paragraph 18.16 (a |
This publication presents the views, thoughts or opinions of the author and not necessarily those of HKA. Whilst we take every care to ensure the accuracy of this information at the time of publication, the content is not intended to deal with all aspects of the subject referred to, should not be relied upon and does not constitute advice of any kind. This publication is protected by copyright © 2024 HKA Global Ltd.